The Earth is warming
The average surface temperature on Earth has risen by 1.1°C since the Industrial Revolution in the 1830s. Most of the warming has occurred in the past 35 years, with the seven warmest years on record taking place since 2010.
This warming is not part of the long-term trend related to glaciations or natural cycles of heating by the sun.
Warming of 1.1°C might not sound like much, but it has immense effects on the climate and environment, causing the melting of glaciers and ice sheets, rising sea levels, extreme weather events, changing rainfall patterns, ocean heating and acidification, damage to ecosystems, and changes in the ranges of plants and animals. These changes are predicted to continue and intensify in the future, especially if the warming continues.
How do we know this?
Temperature trends are based on millions of direct measurements since about 1850 and satellite data in recent decades. Longer records (back to 800,000 years) are made from indicators of temperature in ice cores, cave deposits, tree rings, and coral. The volumes of glaciers and ice sheets are calculated from direct measurements and satellite observations.
Who keeps track of climate change?
The Intergovernmental Panel on Climate Change (IPCC) is the leading international body responsible for assessing the science relevant to the risk of human-induced climate change, it’s impacts, and options for lessening the impacts. The IPCC was formed in 1988 by the World Meteorological Organisation and the United Nations Environment Programme, and has 195 member states. In compiling the most recent major report in August 2018, the IPCC pooled more than 6000 scientific publications, drew contributions from 133 scientists from around the world, and had more than 1000 scientists review the findings. The next major IPCC report is due in 2022.
Global temperature trend since 1880
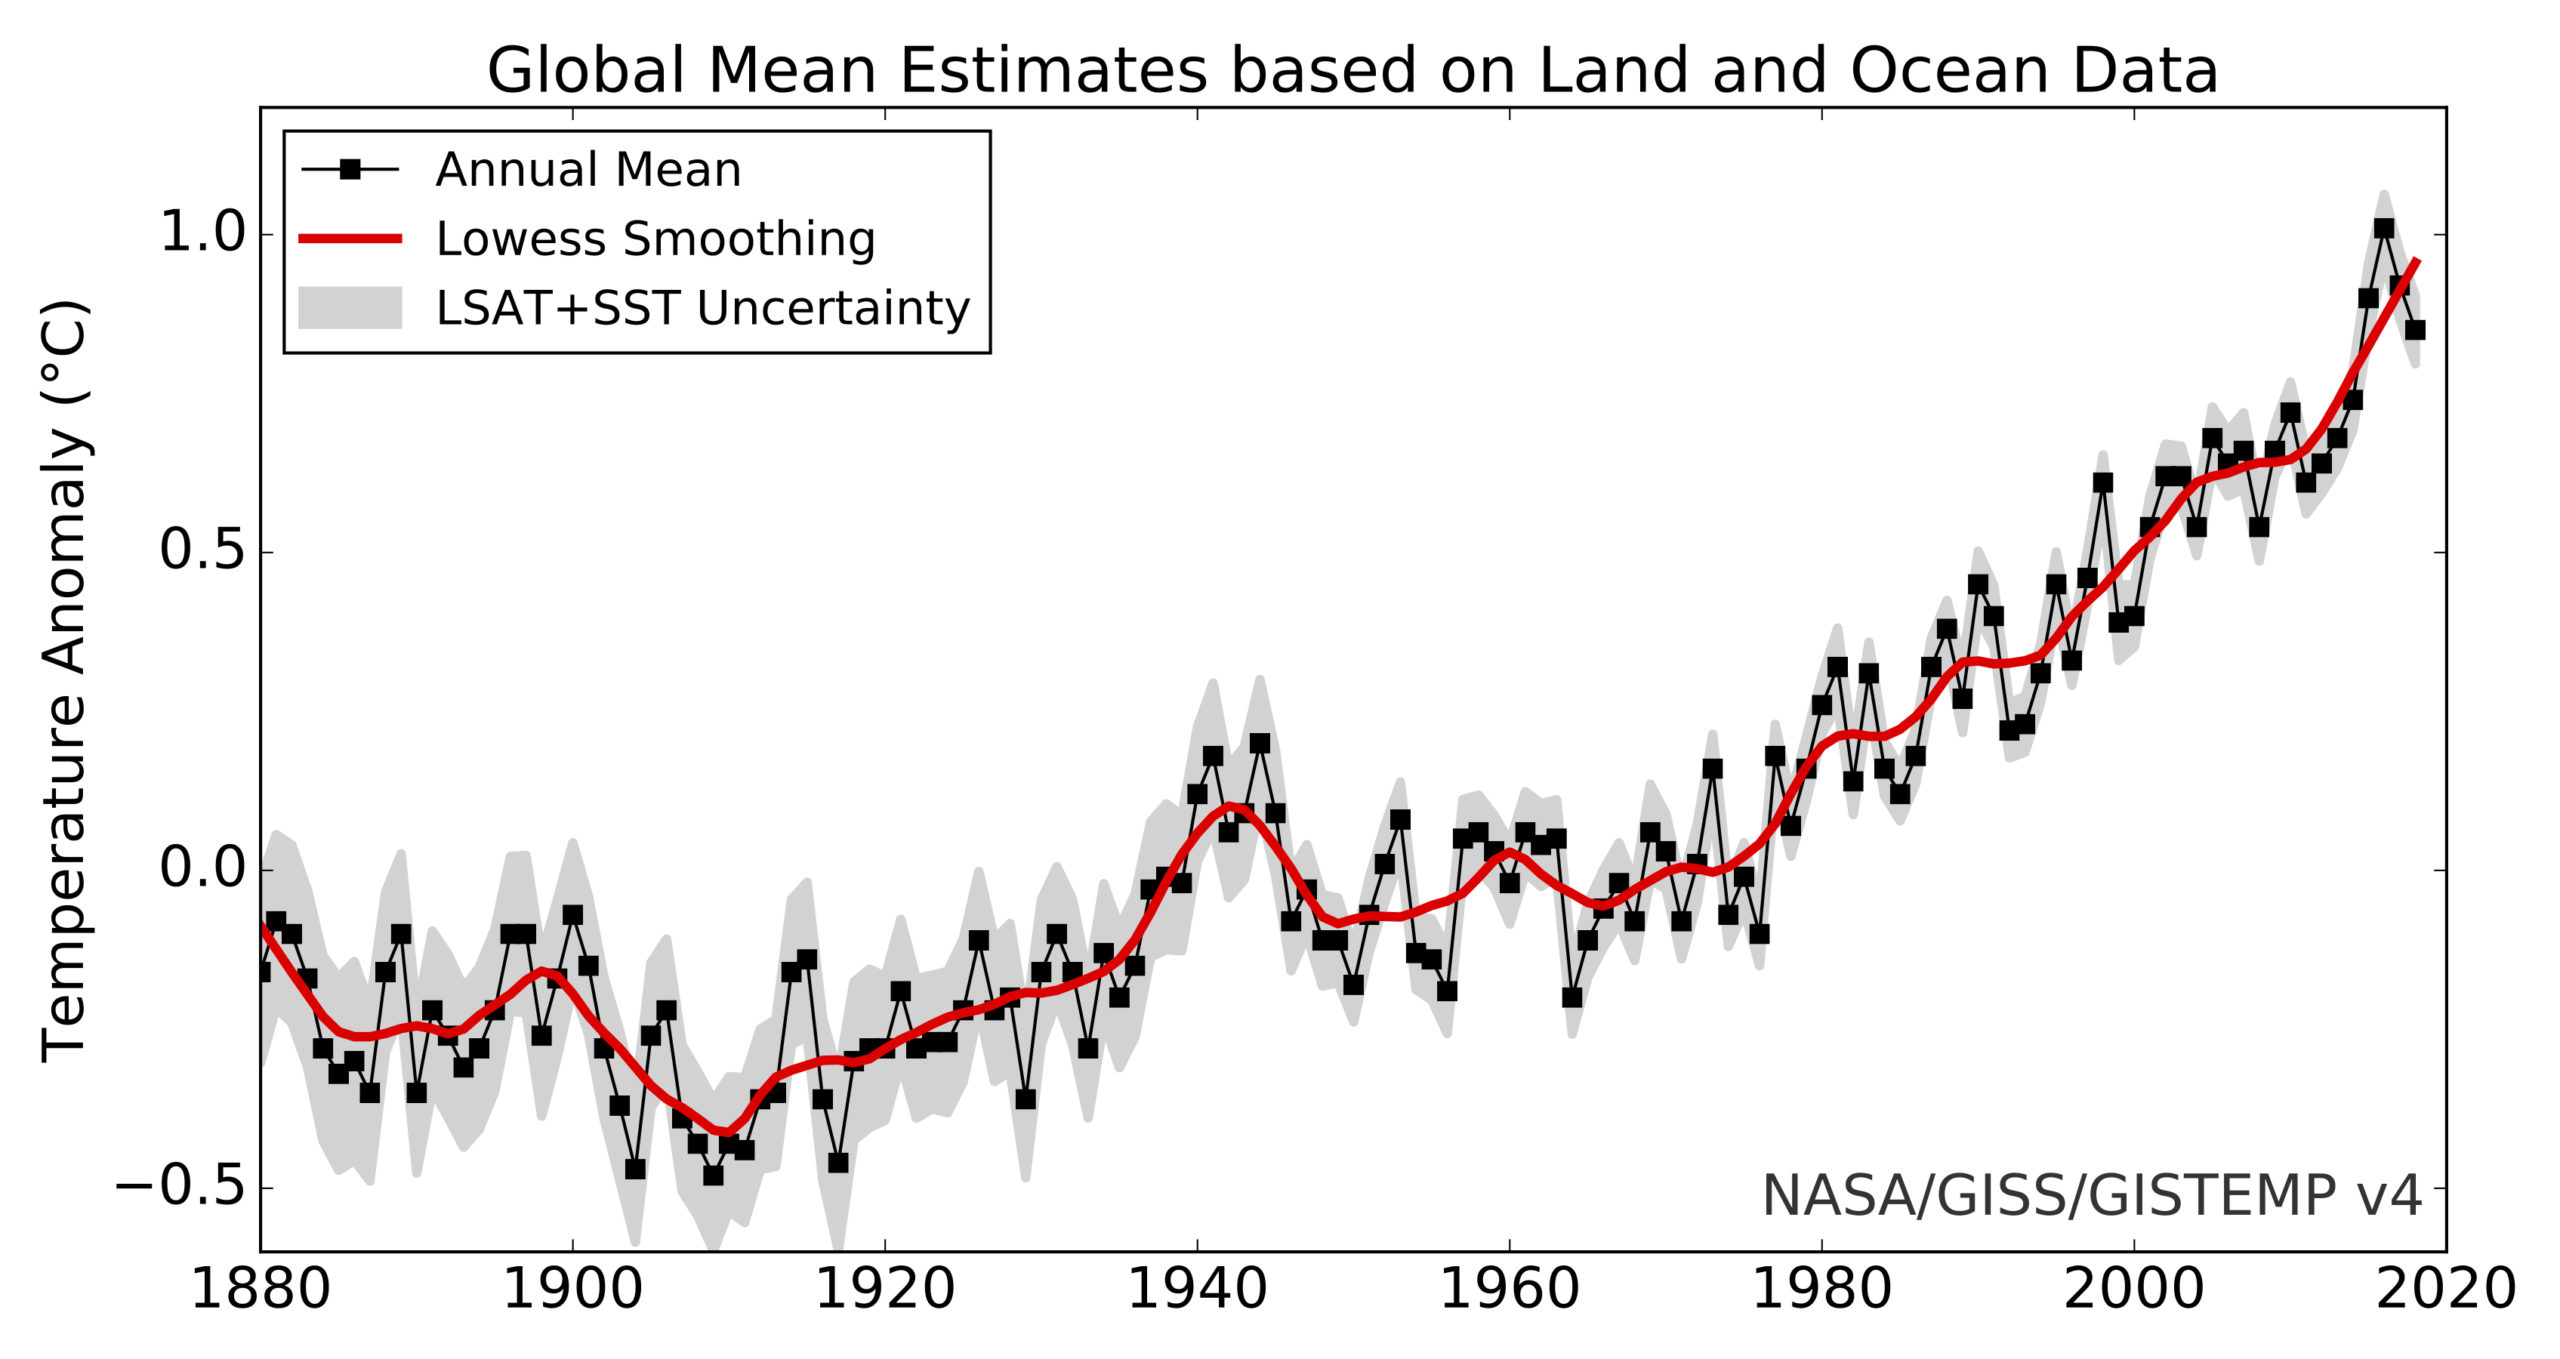
Land-ocean temperature index, 1880 to present, with base period 1951-1980.
The solid black line is the global annual mean and the solid red line is the five-year lowess smooth. The gray shading represents the total (LSAT and SST) annual uncertainty at a 95% confidence interval.
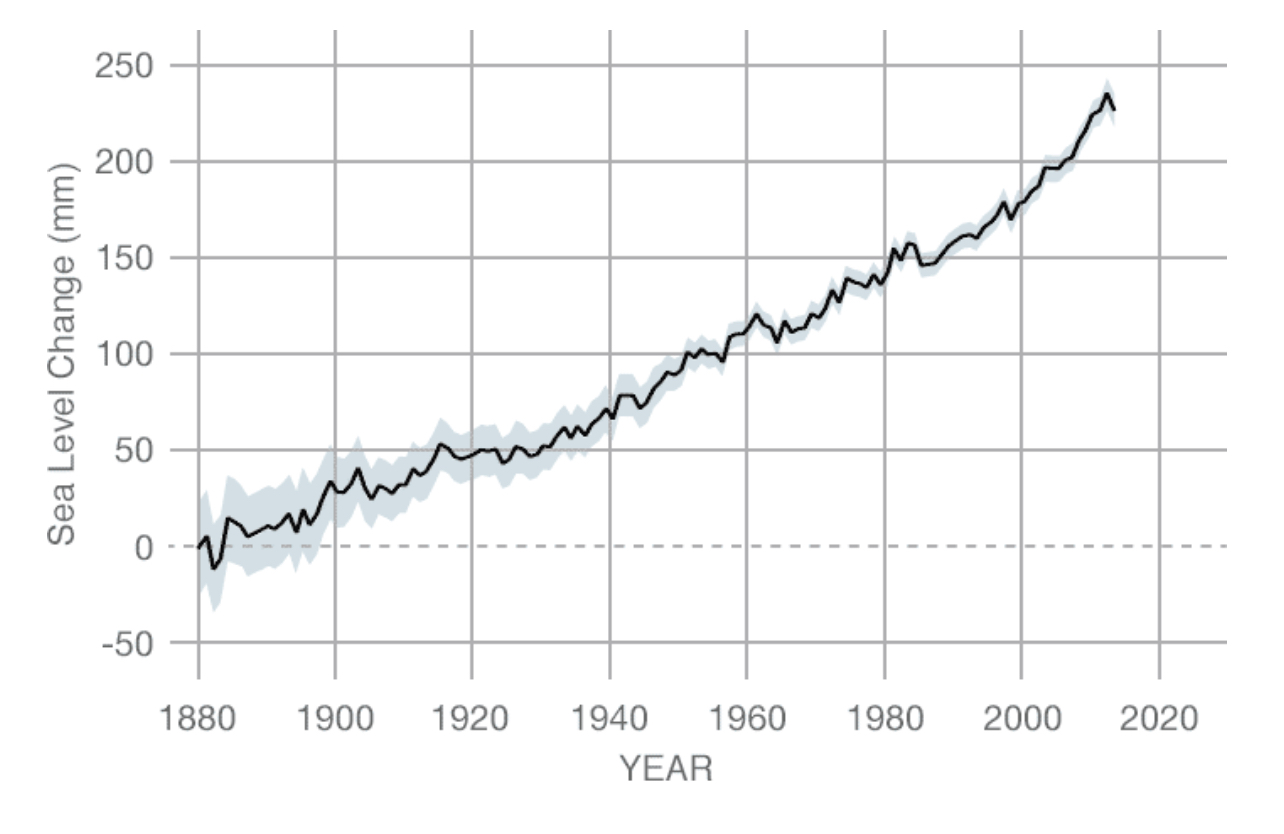
Sea Level trend since 1880
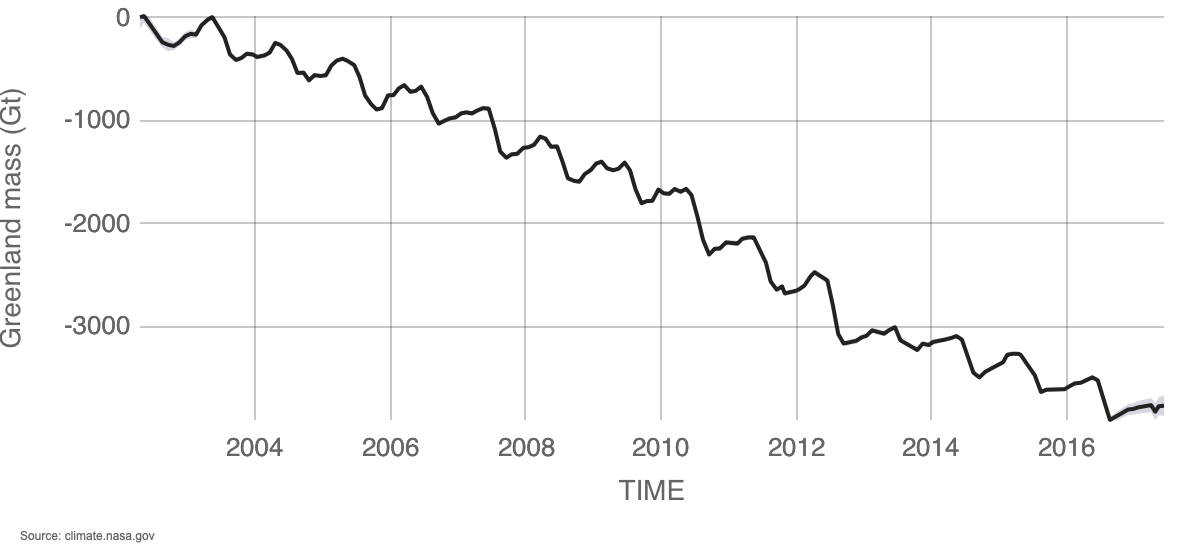
Mass loss of Greenland ice sheet since 2002
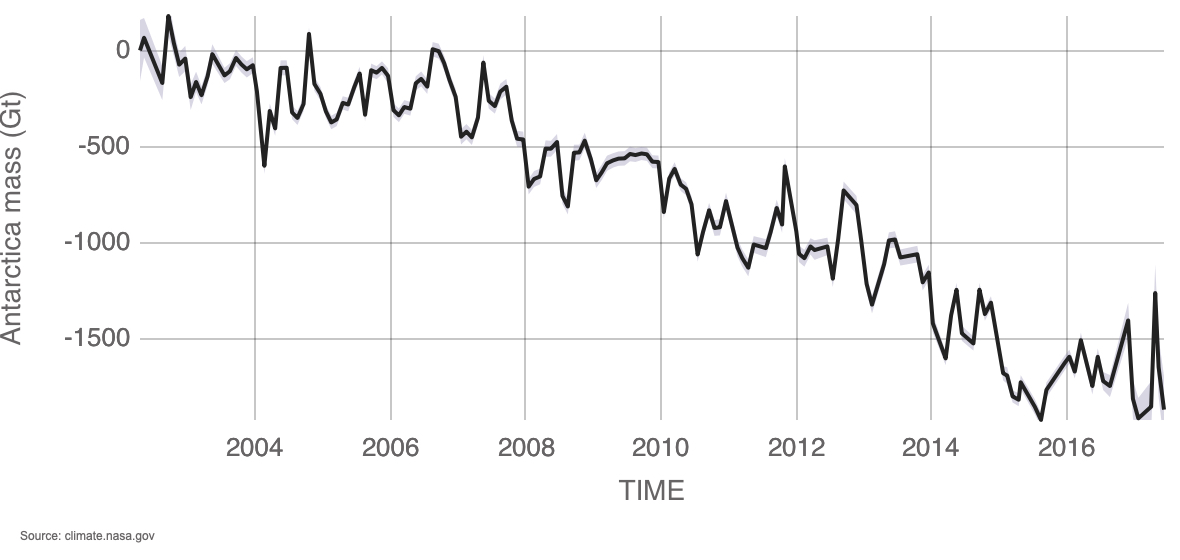
Mass loss of Antarctic ice since 2002
Further Reading
Some of the organisations that provide useful information on climate change are:
Interactive Records
Interactive records of temperature, CO2, sea level, and methane at various timescales are provided by The 2° Institute.
Overview and Evidence
For useful overviews of climate change, see:
The evidence for warming is summarized by:
For summaries of the effects of climate change, see:
Measuring Data
For information on how we measure the volumes of ice sheets and glaciers, see:
For details of how we reconstruct temperature records back to 800,000 years ago, see:
- The 2° Institute
- The US National Oceanic and Atmospheric Administration provides temperature data from ice cores.
Finally, for evidence that the warming is not caused by the Sun, see Climate Communication and NASA.
Greenhouse Gases Heat the Atmosphere
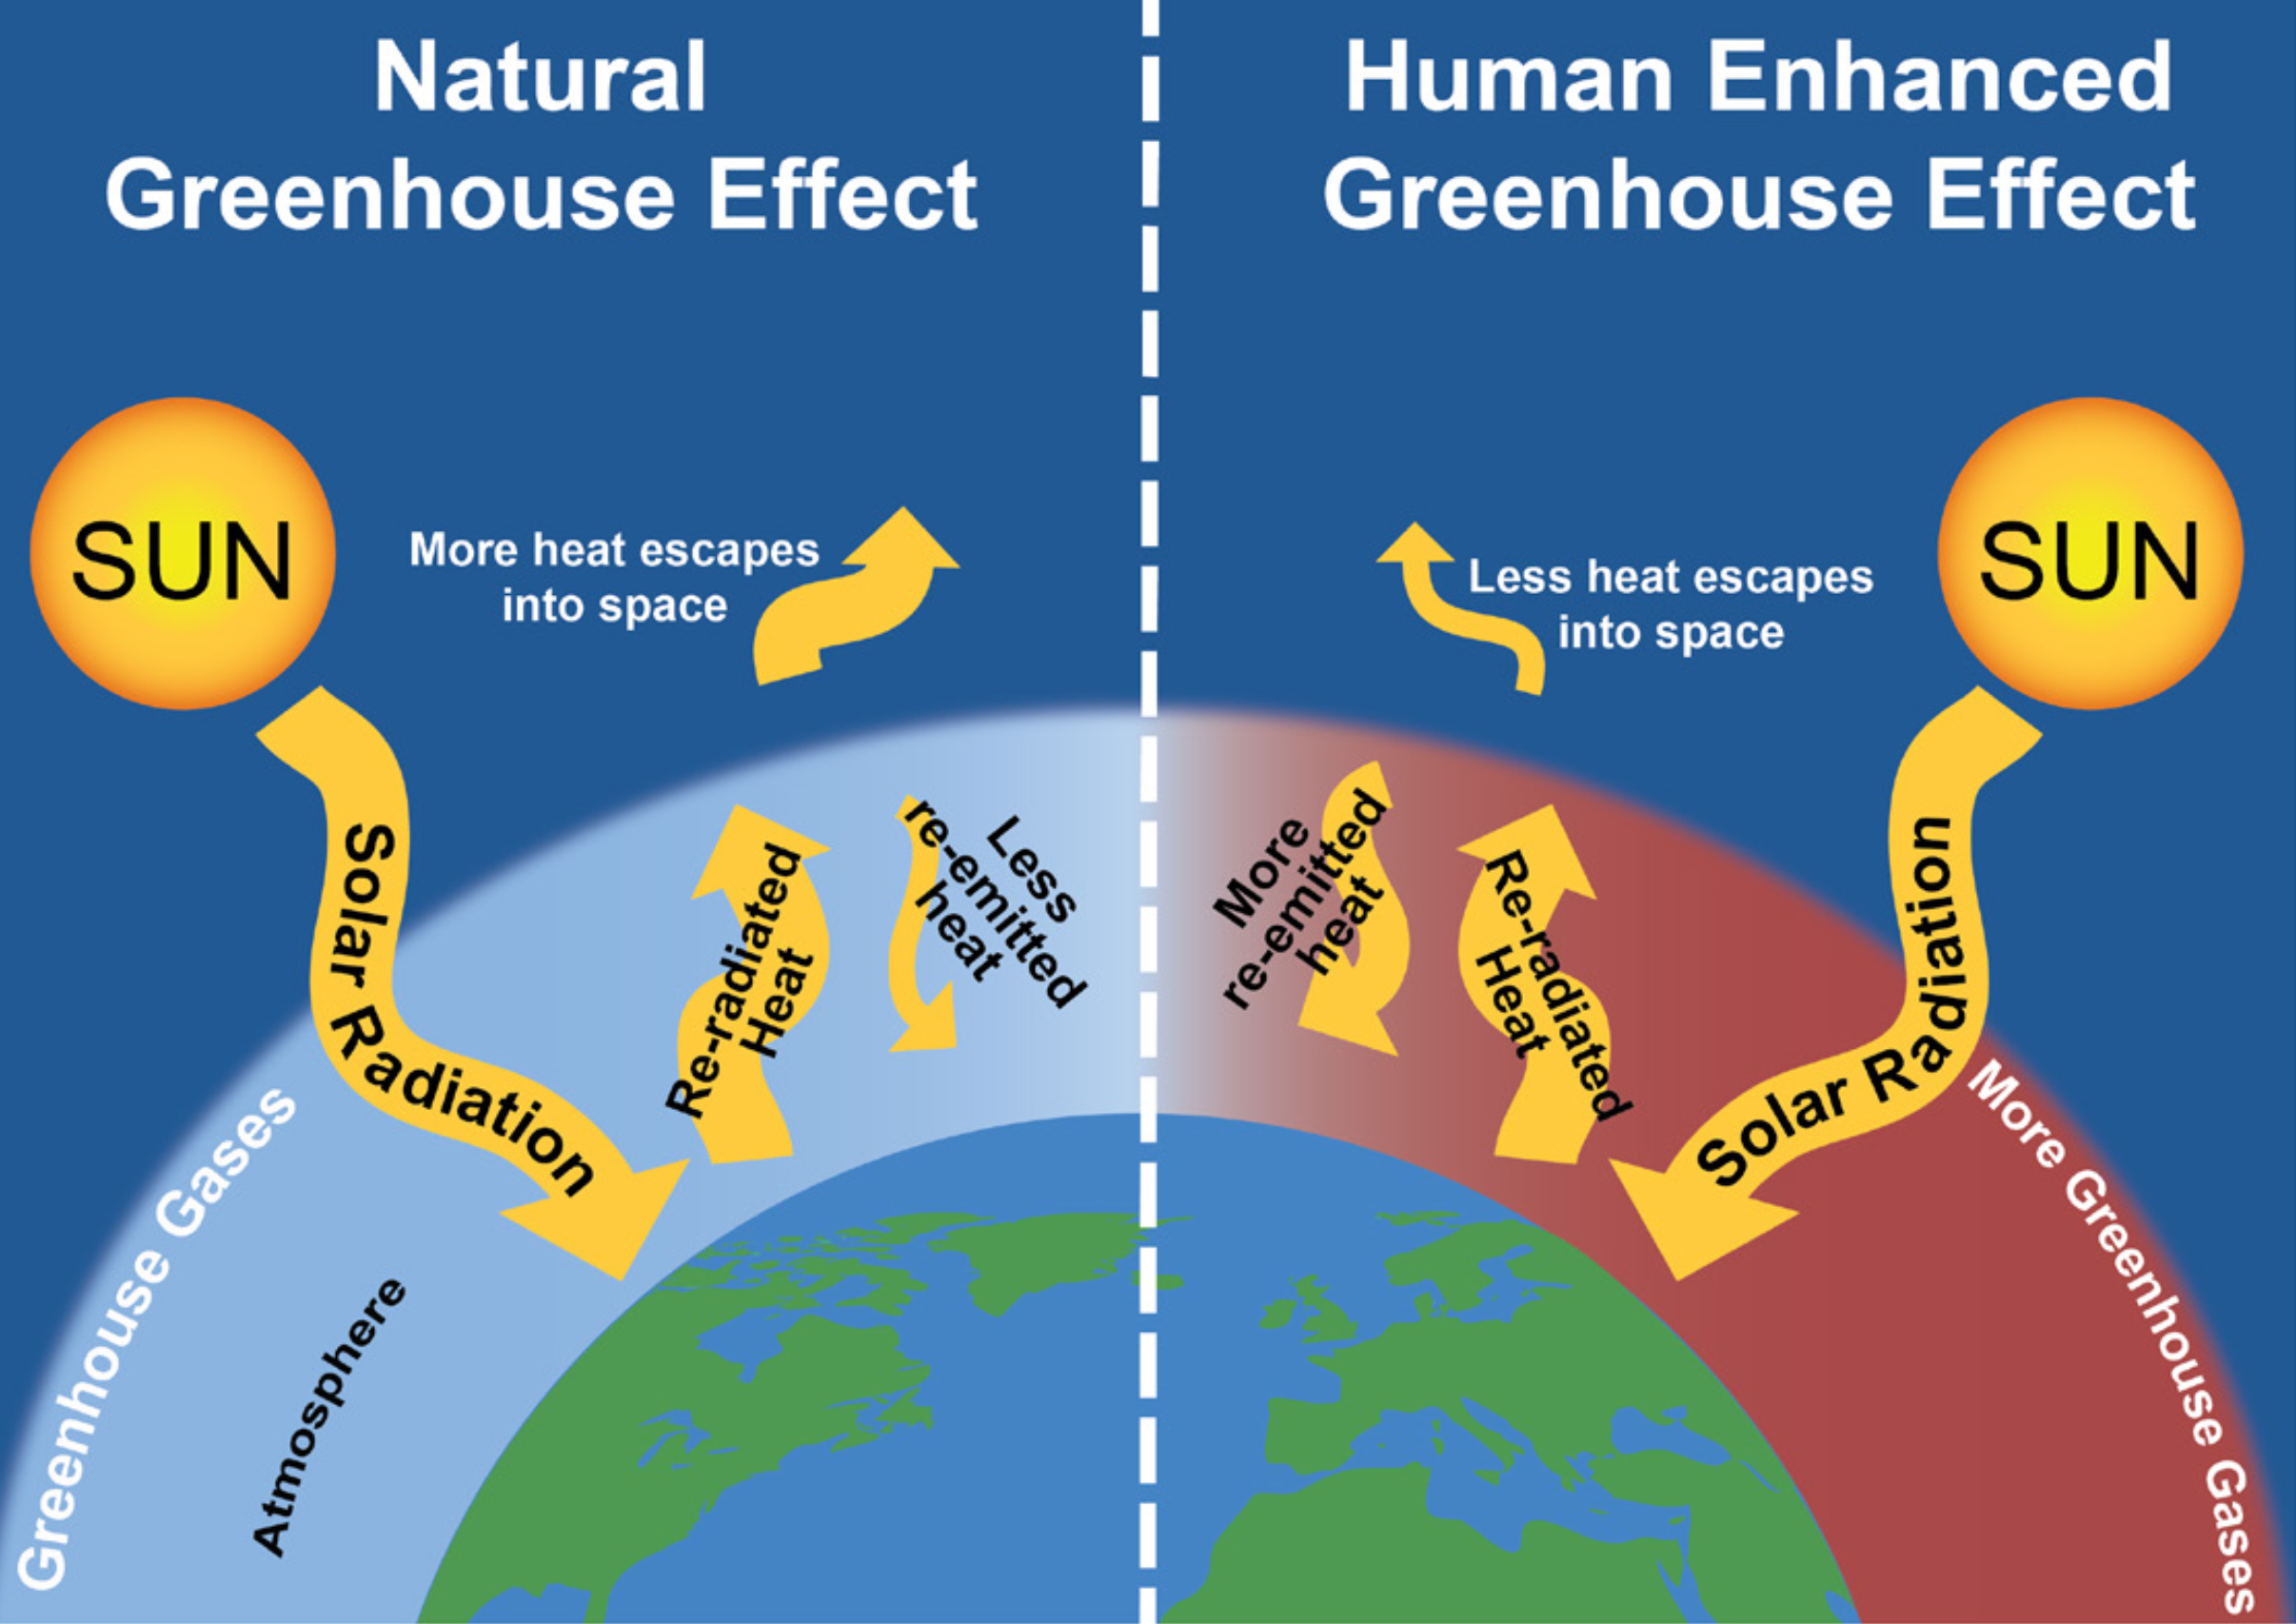
The Sun is the main source of energy for Earth’s climate. Most of the sunlight that reaches the atmosphere is absorbed by Earth’s surface and is re-emitted to the atmosphere, where some escapes to space and the rest is absorbed by greenhouse gases (mainly water vapour (H20), carbon dioxide (CO2), and methane (CH4)) and emitted again in all directions (including back to the surface).
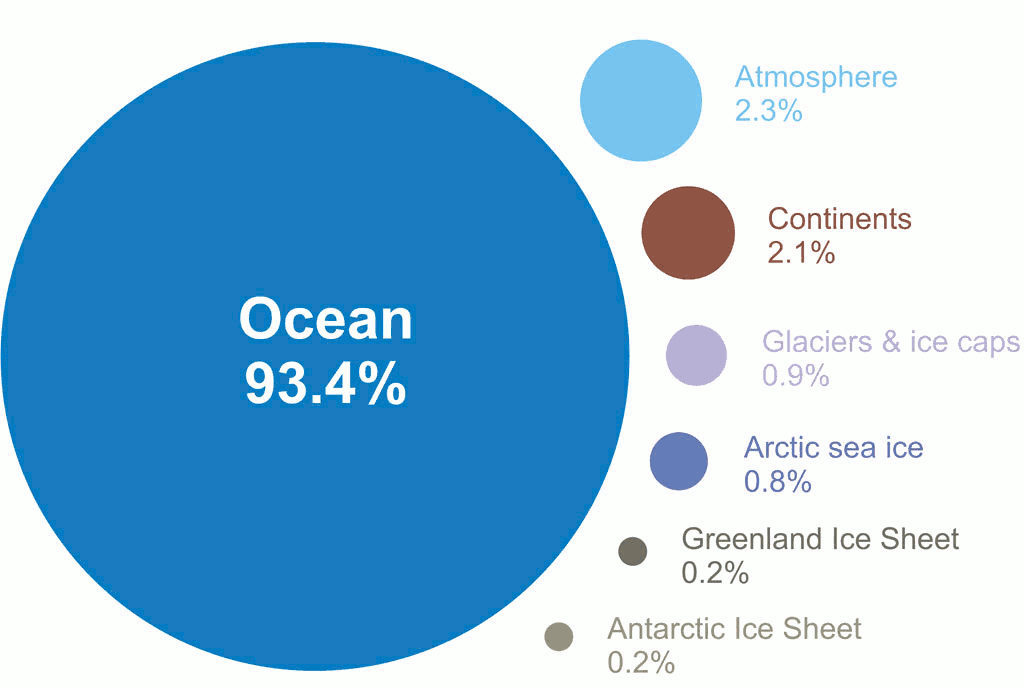
Greenhouse gases prevent heat from escaping into space and result in warming of the atmosphere. This is known as the greenhouse effect. The greenhouse effect occurs naturally and is important because without its warming, the average temperature on Earth would be –18°C. The recent warming is due to increasing amounts of greenhouse gasses in the atmosphere. To give some idea of the scale of the problem, we know that since 1955, over 90% of the excess heat resulting from increasing greenhouse gases has been transferred to the oceans, resulting in ocean warming, and just 2% of the heat has remained in the atmosphere. If the oceans had not taken up that heat, the temperatures on Earth today might be around 50°C.
Where Global Warming is Going
Where the warming is going – this figure shows how much of the heat energy from global warming is going into the various components of the climate system for the period 1993 to 2003, calculated from IPCC AR4 5.2.2.3.
How do we know this?
The greenhouse effect is well understood and is supported by observations, measurements, experiments, and our understanding of the physics of the atmosphere. For example, satellites measurements show that as greenhouse gases increase in the atmosphere, less energy is escaping to space at the wavelengths that greenhouse gases absorb energy.
The Greenhouse Effect
More on the Greenhouse Effect
For explainers of the greenhouse effect, see:
More on Greenhouse Gases
For information on greenhouse gases, see:
More on where the heat is going
For information on where the extra heat from greenhouse gasses has gone, and on warming of the oceans, see:
Human Activity
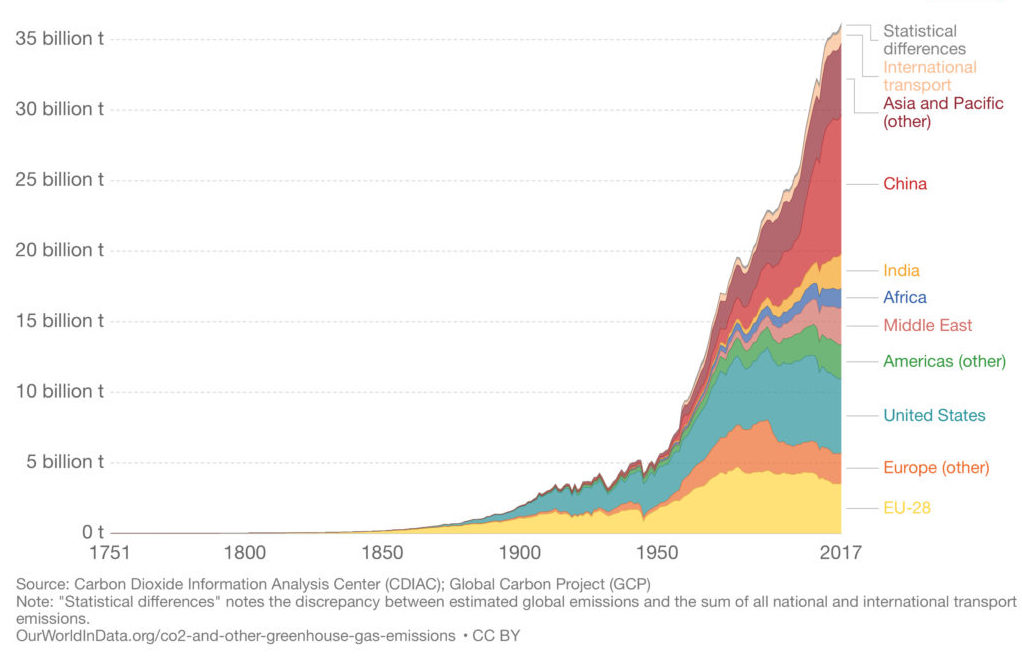
Human activity is releasing huge amounts of greenhouse gases into the atmosphere, mainly from the combustion of fossil fuels (oil, gas, coal) and agriculture. There is scientific agreement that recent increases in greenhouse gases are due to human activity.
How do we know this?
We can calculate the greenhouse gas emissions from human activity and measure greenhouse gas concentrations in the atmosphere.
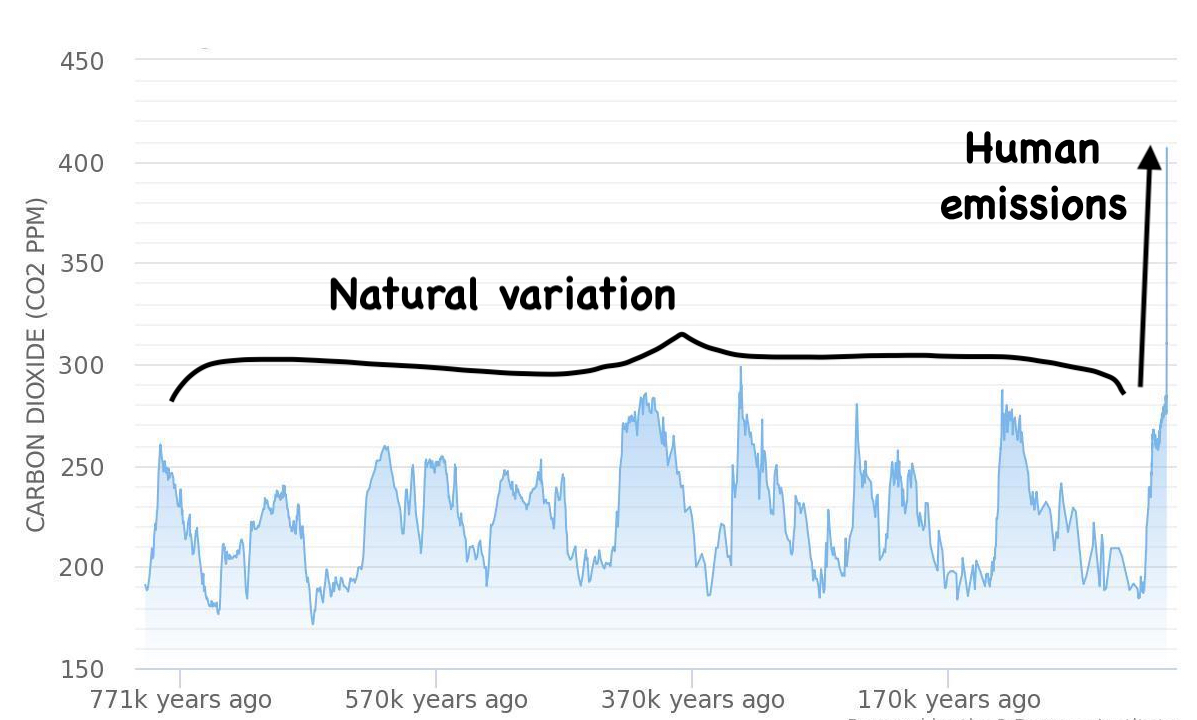
Global CO2 Levels
CO2 trend for the past 800,000 years highlighting natural CO2 variations compared with recent human-induced CO2 increase.
Human CO2 Emissions vs Atmospheric Concentration
Further Reading - Greenhouse Gas Emission
For diagrams that show greenhouse gas emissions, see:
Further Reading - Effects of Human Activity
For summaries of how we know that human activity causes climate change, see:
Further Reading - Volcanic Eruptions
For explanations of how we know that volcanic eruptions are not to blame for climate change, see:
Climate change and ecosystems
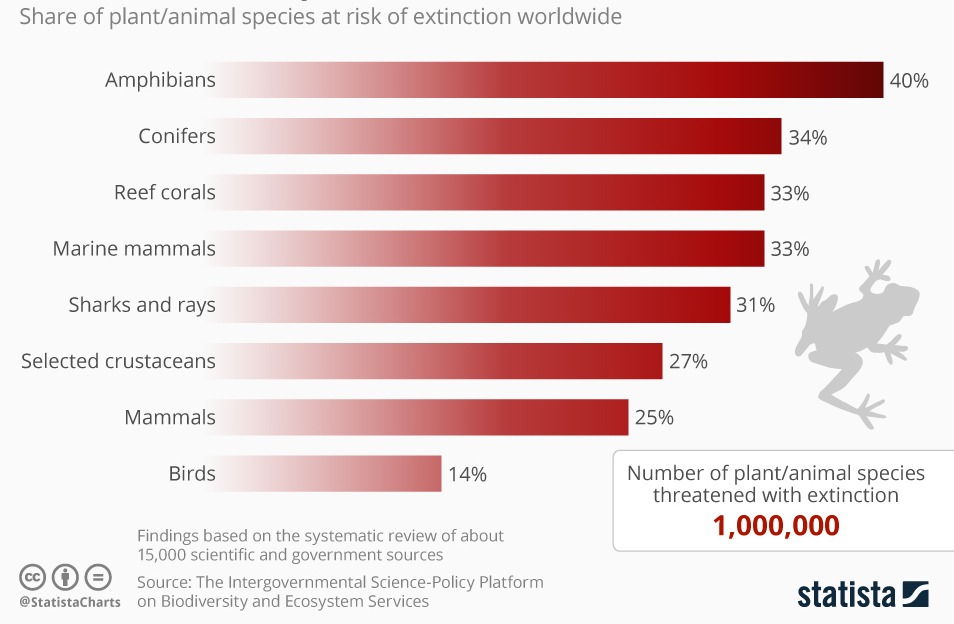
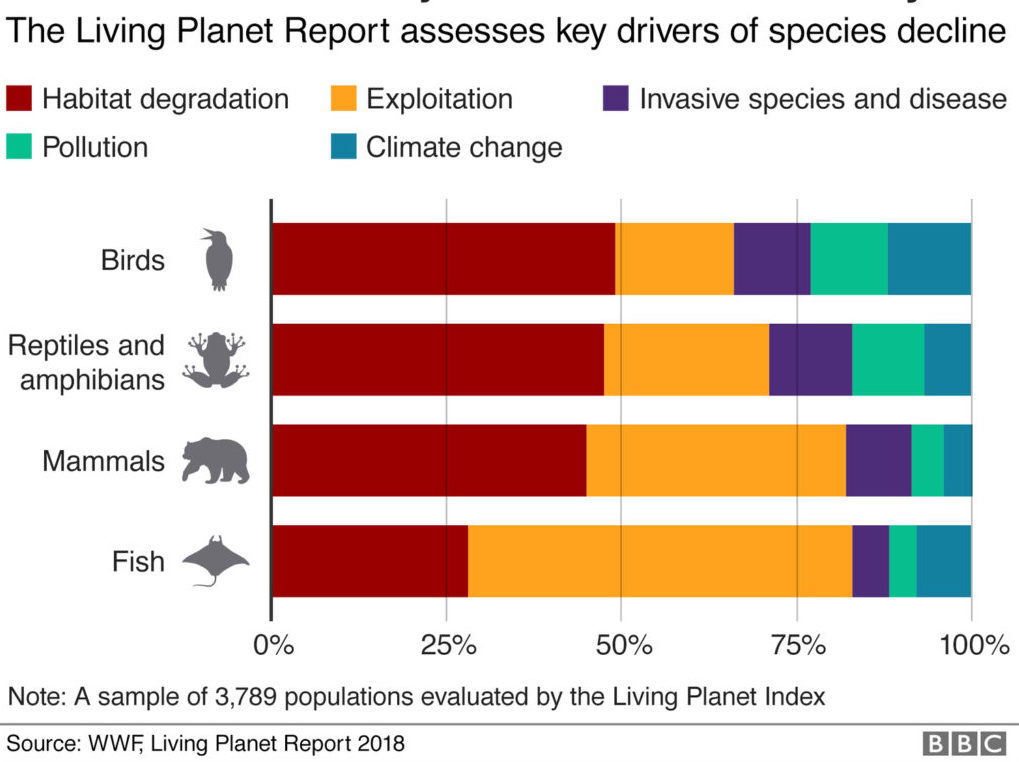
Climate change and related human activities such as habitat destruction, livestock agriculture, and environmental pollution are damaging ecosystems worldwide and have led to massive losses of wildlife.
The loss of wildlife is so severe that human actions have led to a mass extinction event, the first since the dinosaurs died out nearly 65 million years ago.
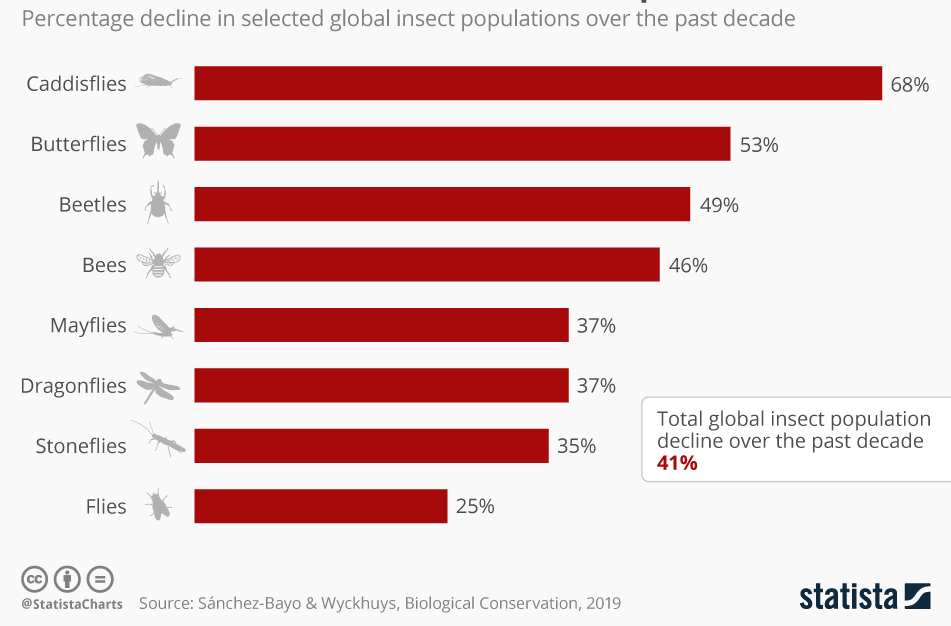
Coral reefs, one of the most biodiverse ecosystems on earth, are likely to be completely lost in coming decades, and pollinating insects are in decline. There has been a 50% loss of wild animals on Earth since 1970, and an estimated 1 million species are threatened with extinction. Today, 96% of mammals on Earth (in terms of biomass) are livestock or humans.
Ecosystem damage is important because plants and animals cannot adapt to rapid changes in the environment, leading to falling numbers and extinction in some cases.
Biodiversity is crucial for food security, human health, and fighting disease. It supports healthy ecosystems that all life depends on, and provides ecosystem services that are critical to our survival and the economy, such as controlling invasive or pest species, soil fertility, regulating climate, pollinating plants, purifying air and water, and breaking down waste.
These ecosystem services are interrelated in ways that are not fully understood, meaning that careless human activity can have severe negative impacts on the environment.
How do we know this?
Climate change is assessed from direct measurements and observations. Biodiversity and environmental health are assessed from surveys and studies of wildlife and ecosystems.
Further Reading
For summaries of the state of biodiversity and ecosystems, see:
For a report on the state of the environment in New Zealand, see:
For information on the importance of biodiversity, see:
For information on the current mass extinction event, see:
- United Nations
- Center for Biological Diversity
- Intergovernmental Science-Policy Platform on Biodiversity and Ecosystem Services
Evidence for climate change is summarised by:
- the Australian Academy of Science
- NASA
- New Zealand’s Ministry for the Environment
Scientists agree
Recent studies have shown that 90%–100% of active climate researchers agree that recent global warming and climate change are caused by human activity. The IPCC, which has 195 member countries and provides assessments written by hundreds of leading scientists, concludes with certainty that greenhouse gases from human activities are the main cause of observed climate change since 1950.
Every major scientific organisation worldwide recognises that human activity is causing climate change and the need to take action (including NASA, Académie des Sciences (France), Academy of the Royal Society of New Zealand, American Association for the Advancement of Science, American Meteorological Society, American Geophysical Union, Geological Society of America, World Meteorological Society, World Wildlife Fund, Australian Bureau of Meteorology, Chinese Academy of Sciences, Geological Society of London, Royal Society of the United Kingdom, and the Royal Meteorological Society UK).
Arguments against human activity as a driver of climate change have been shown to be unfounded (for details, see the Further Reading section).
How do we know this?
We know there is scientific consensus that humans are causing climate change from surveys, studies, and reports.
Further reading
For a summary of studies on the degree of consensus among climate scientists that humans are causing global warming, see:
- a paper in Environmental Research Letters
Many sites debunk myths regarding climate change, including:
- the California Government
- the magazine New Scientist
- Grist
- ScienceBlogs
- Skeptical Science
Limiting warming to 1.5°C
The 2016 Paris Agreement, which was signed by 195 states and deals with greenhouse gas emissions and climate change, requires member nations to limit global temperature rise to below 2.0˚C, and as close as possible to 1.5°C.
In August 2018 the IPCC released a report titled ‘Global Warming of 1.5°C’ that concludes the risks of catastrophic climate change can be reduced by limiting warming to 1.5°C rather than 2°C, meaning that 1.5°C warming is the key target.
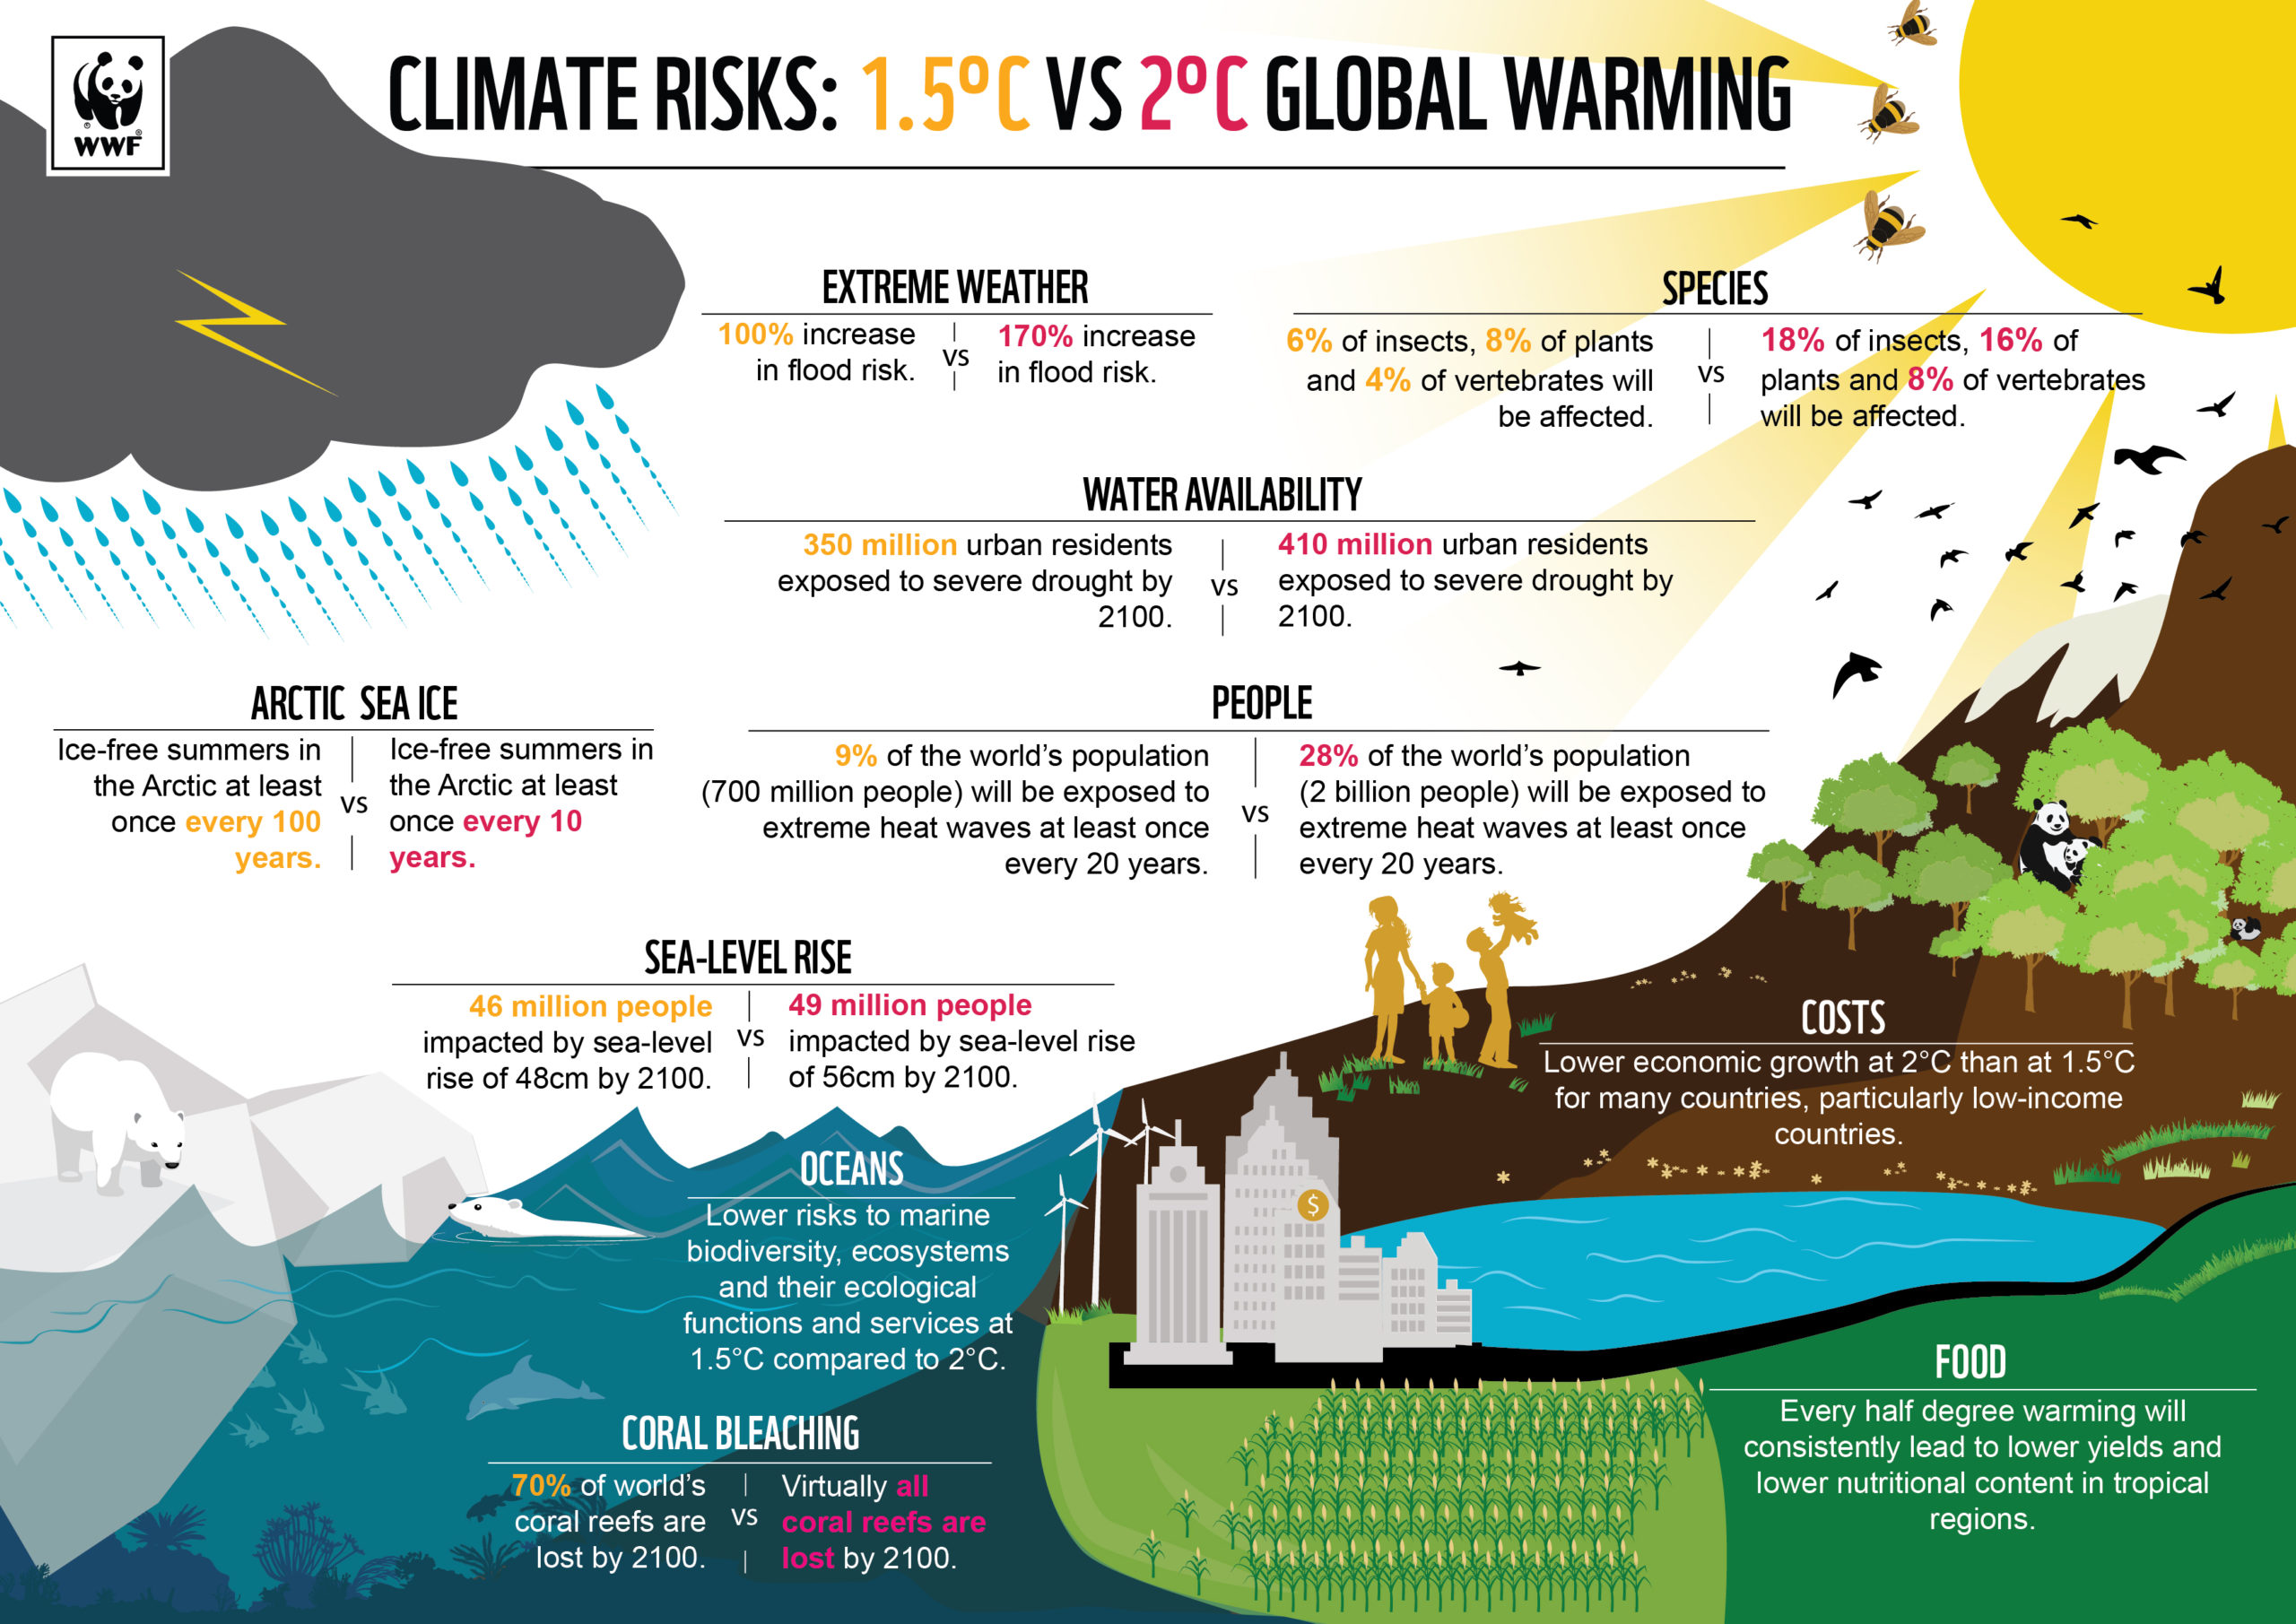
Although a difference of 0.5°C might seem small, it makes a huge difference in terms of ice and glacier melting, heat waves, coral bleaching, extreme weather events, and the habitats of plants and animals.
How do we know this?
Thousands of studies and data sources, summarised by the IPCC in the special report ‘Global Warming of 1.5°C’.
Further Reading
The Special Report on Global Warming of 1.5°C (2018) is available from the IPCC
For explainers of the 1.5°C target, see:
- the World Wildlife Fund – climate and energy.
- the World Wildlife Fund – half a degree
- the Center for Climate and Energy Solutions
Limiting global warming to 1.5°C
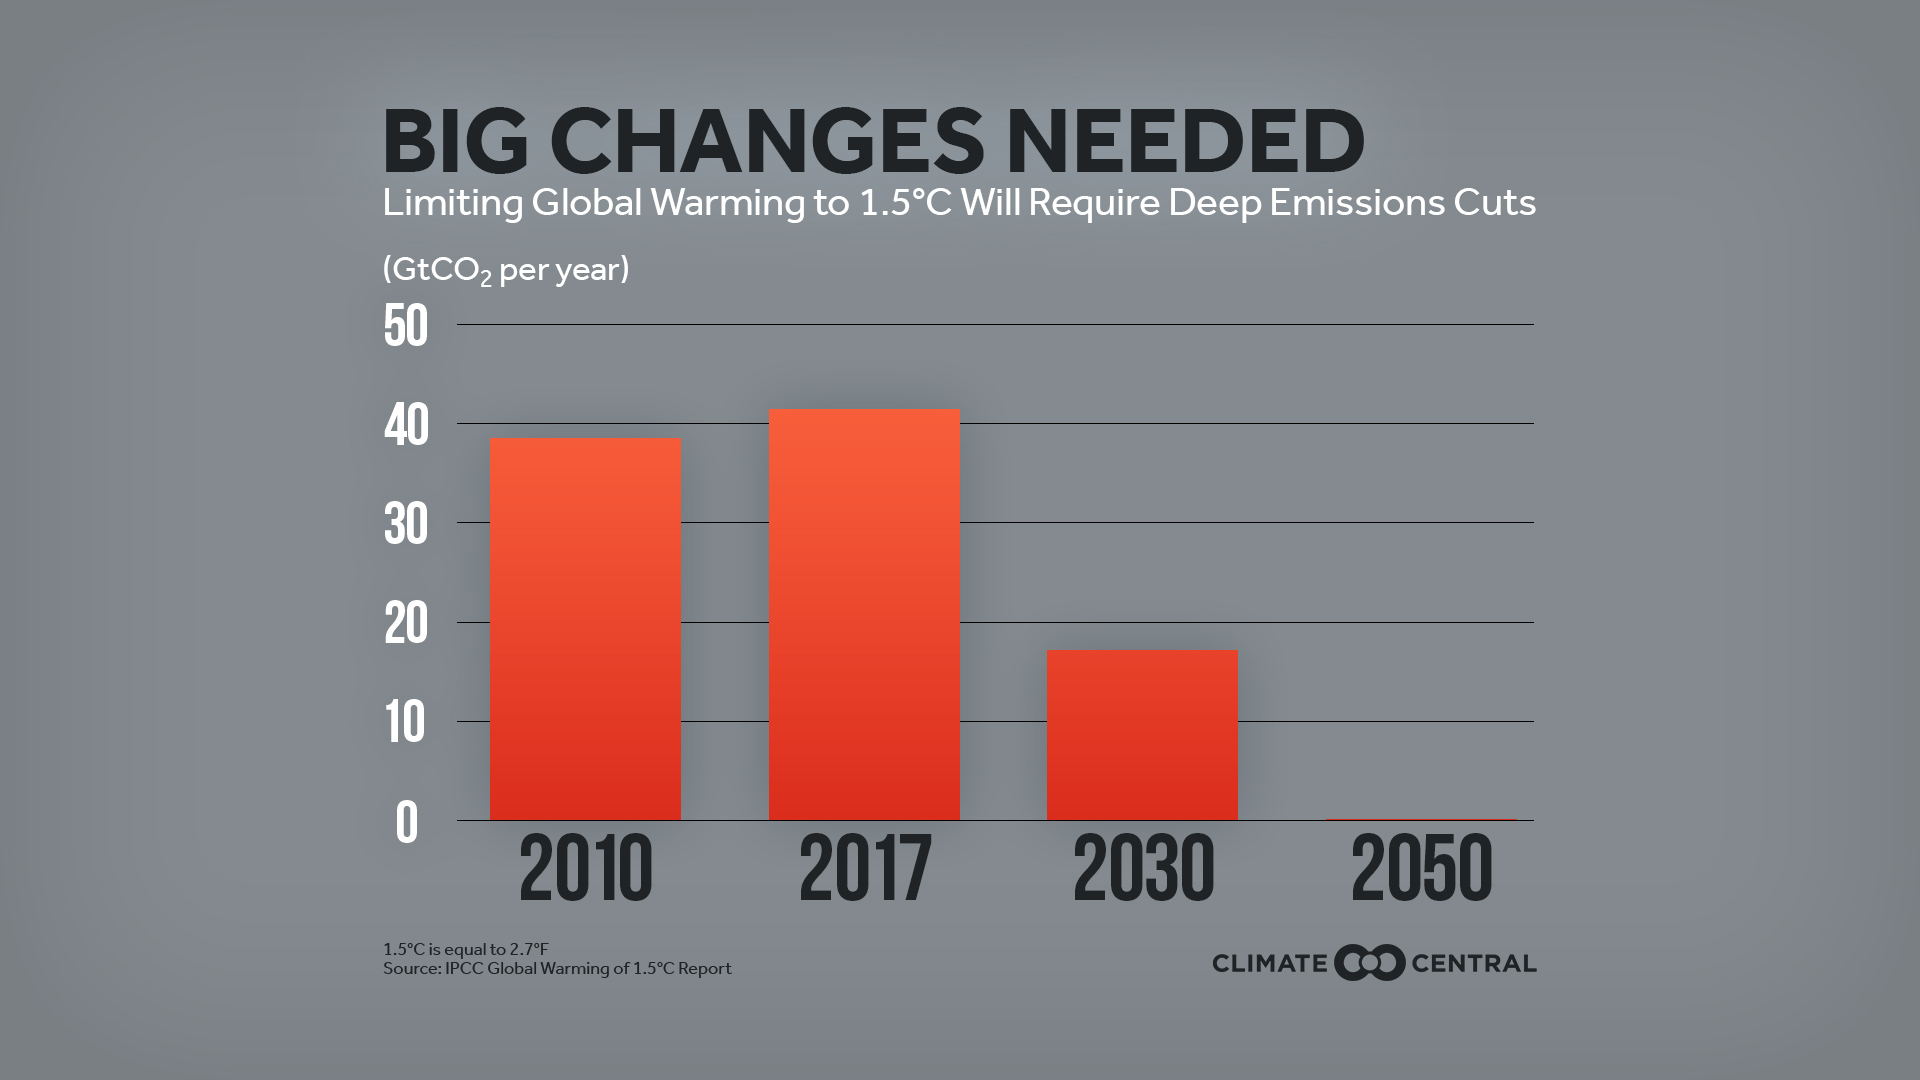
To limit global warming to 1.5°C requires strong and immediate action. The IPCC states that meeting this goal requires “rapid and far-reaching transitions in energy, land, urban and infrastructure (including transport and buildings), and industrial systems”. The UN states that decarbonization of the energy sector and electrification of transport are necessary and possible.
Therefore, it is necessary to reduce global greenhouse gas emissions immediately and reach net zero emissions as soon as possible, by 2050 at the latest, although some groups advocate for net zero emissions by 2025. In addition, CO2 will have to be removed from the atmosphere because we have already locked in long-term warming that needs to be reversed, yet the technology to remove CO2 on this scale has not been developed.
To reduce our dependence on technology that is not yet viable would require becoming carbon neutral by 2025. In any event, to reduce emissions by this scale, it is necessary to move away from fossil fuels and livestock agriculture, and for countries, cities, companies, and individuals to act immediately.
How do we know this?
From studies of emissions and temperature trends, and future projections.
Further reading
For overviews of the need to limit warming to 1.5°C, see:
To track New Zealand’s emissions, see:
The Special Report on Global Warming of 1.5°C (2018) is available from the IPCC .
Government actions
To meet its commitment under the Paris Agreement, the New Zealand government has recently passed legislation (the Climate Change Response (Zero Carbon) Amendment Bill) to reduce all greenhouse gases (except methane from agriculture) to net zero by 2050.
Agricultural methane emissions are separate from the main reduction targets, with targets of 10 per cent below 2017 levels by 2030, and 24–47 per cent below 2017 levels by 2050.
The independent Climate Change Commission has been established to provide advice to the government and monitor progress toward meeting its emission targets. The commission presented its first report, including the first three 5-year emissions budgets, in February 2021. In turn, the New Zealand Government presented an emissions reduction plan in May 2022.
It is almost certain that the government’s approach is sufficient to meet its objectives, as the latest Emissions Gap Report by the UN (October 2021) states that to limit global warming to 1.5°C requires emissions to be halved by 2030.
Climate Action Tracker, which is a leading independent scientific analysis that tracks the climate action of governments worldwide, rates New Zealand’s progress as ‘Highly insufficient’, meaning that it is not consistent with holding warming below 2°C (let alone 1.5°C), and is instead consistent with warming of between 3°C and 4°C. This poor rating is given because the government has introduced few policies to actually cut emissions and because agriculture is exempt from the net-zero emissions target, among other factors.
How do we know this?
Reports compiled by the New Zealand Government and other agencies.
For information on the Climate Change Response (Zero Carbon) Amendment Bill, see:
For an outline of the Paris Agreement, see:
For information on climate change and farming in New Zealand, see:
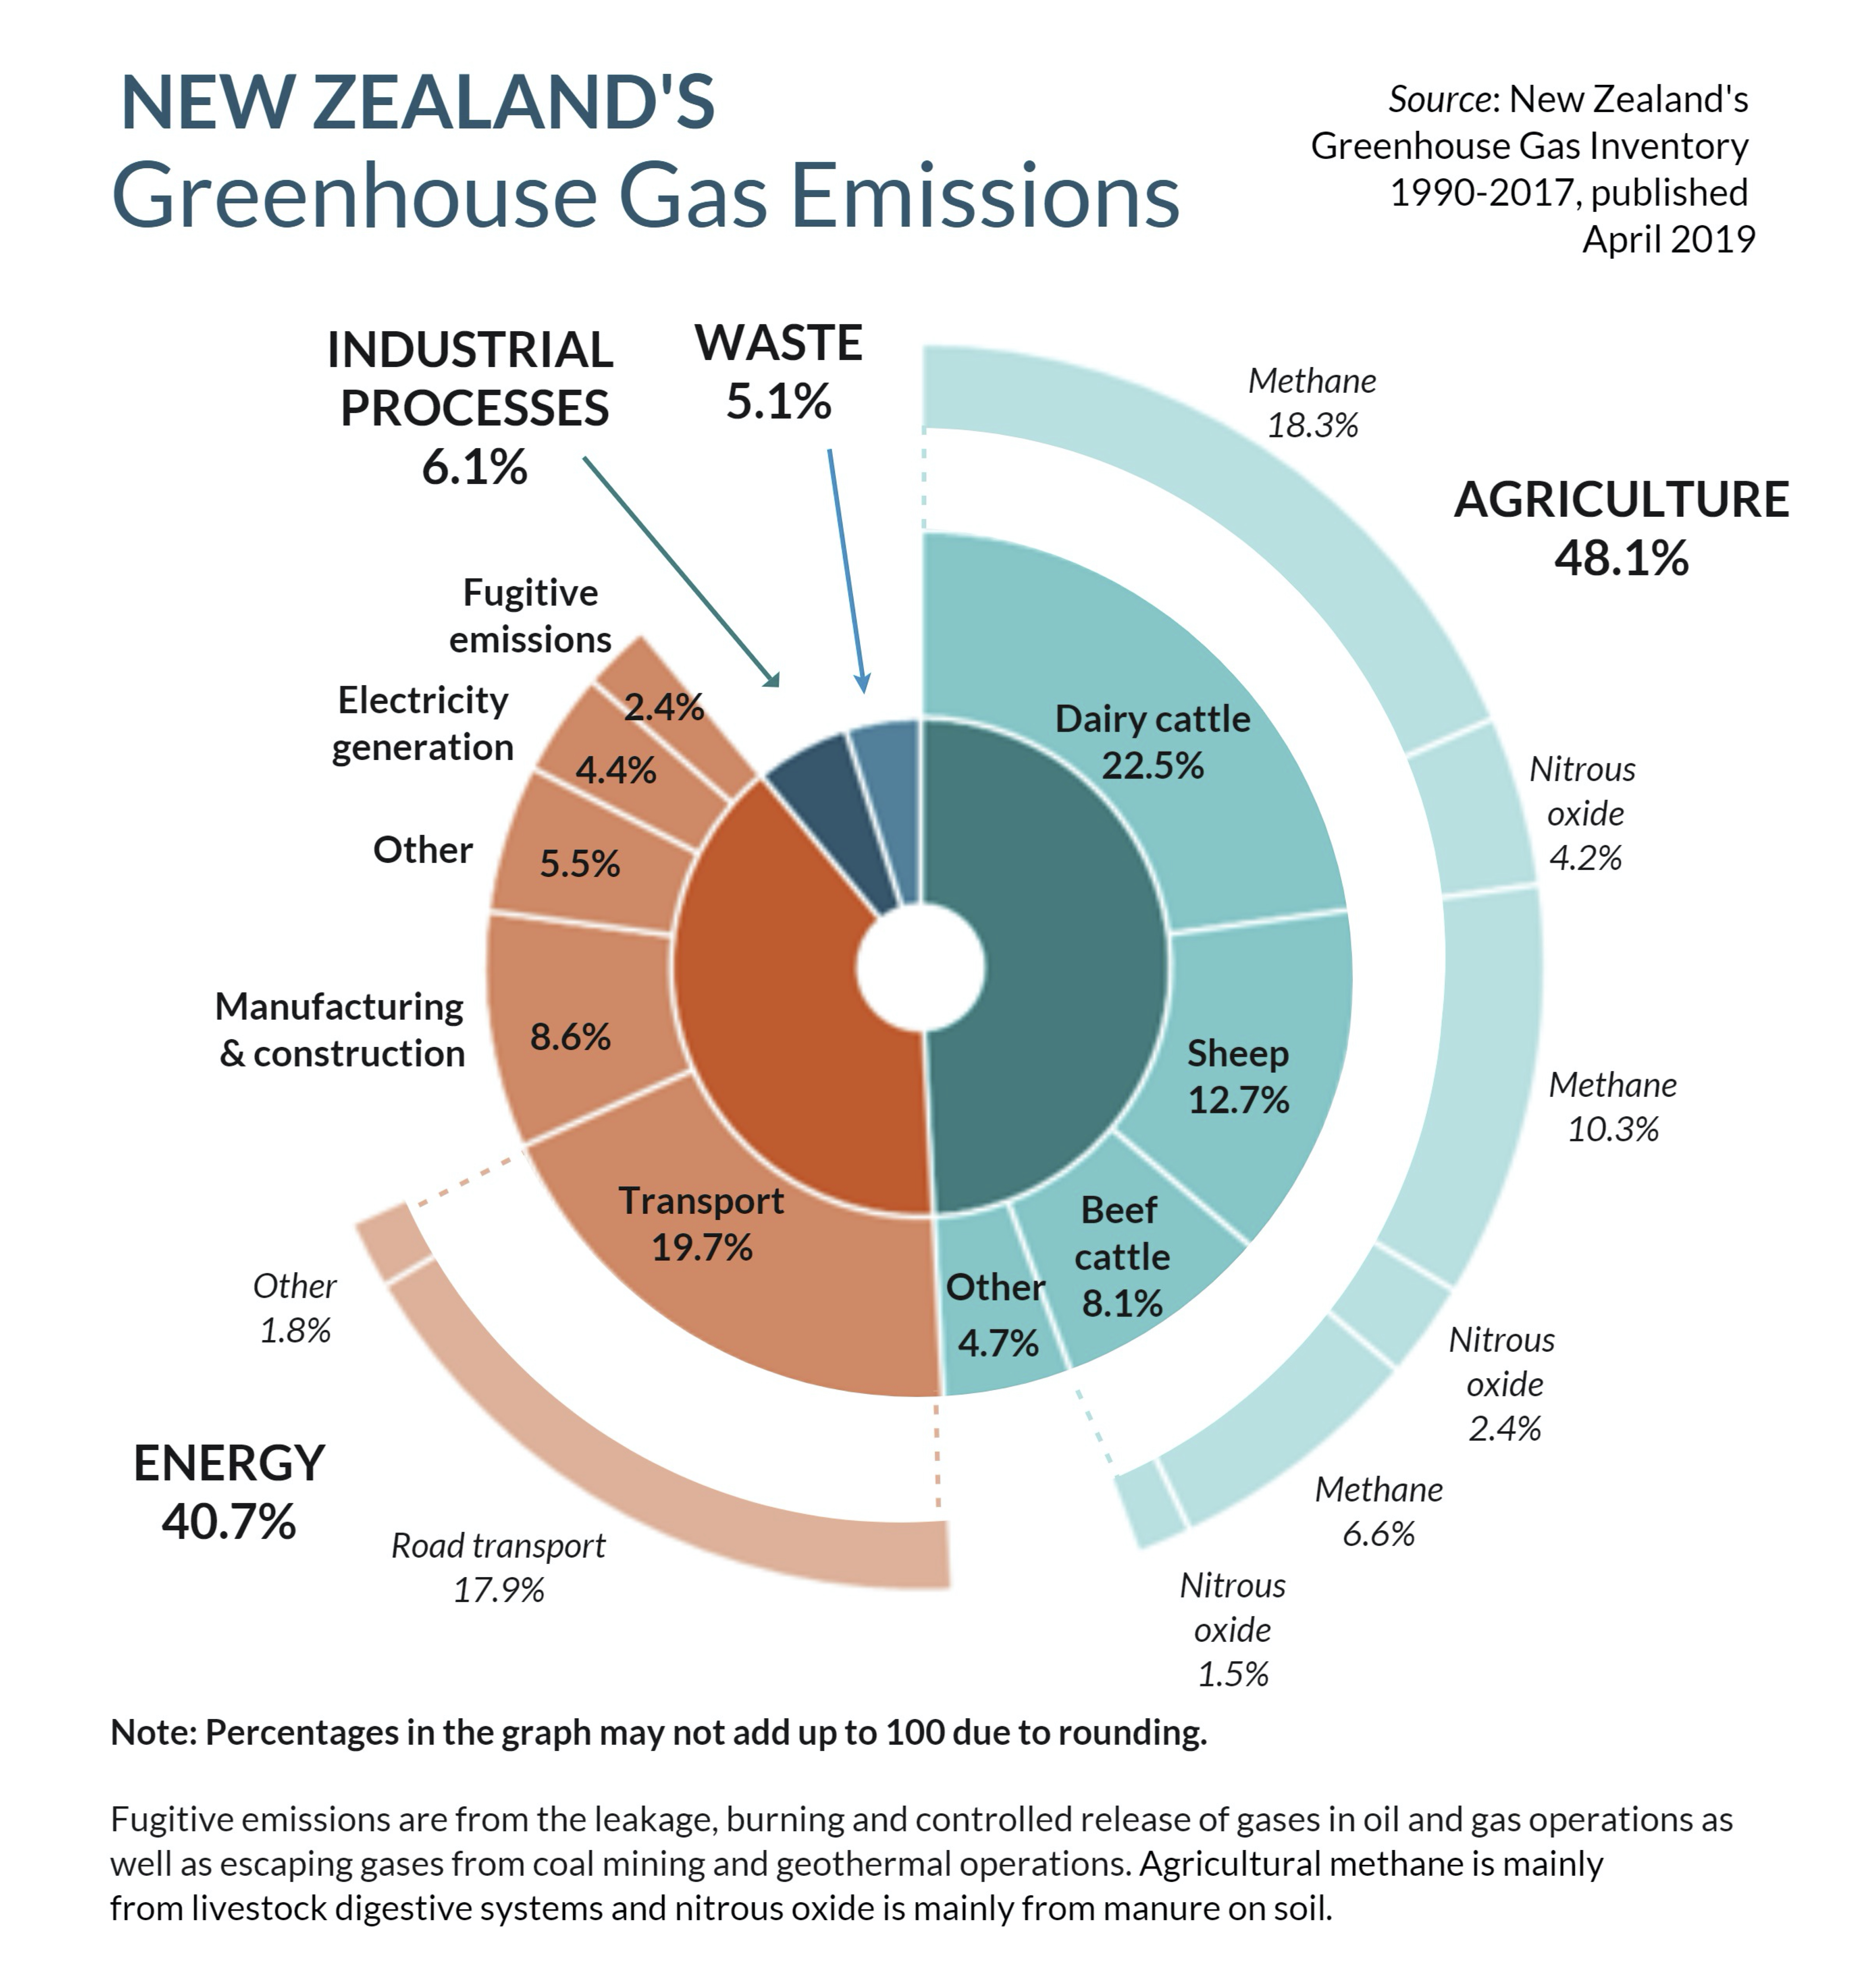
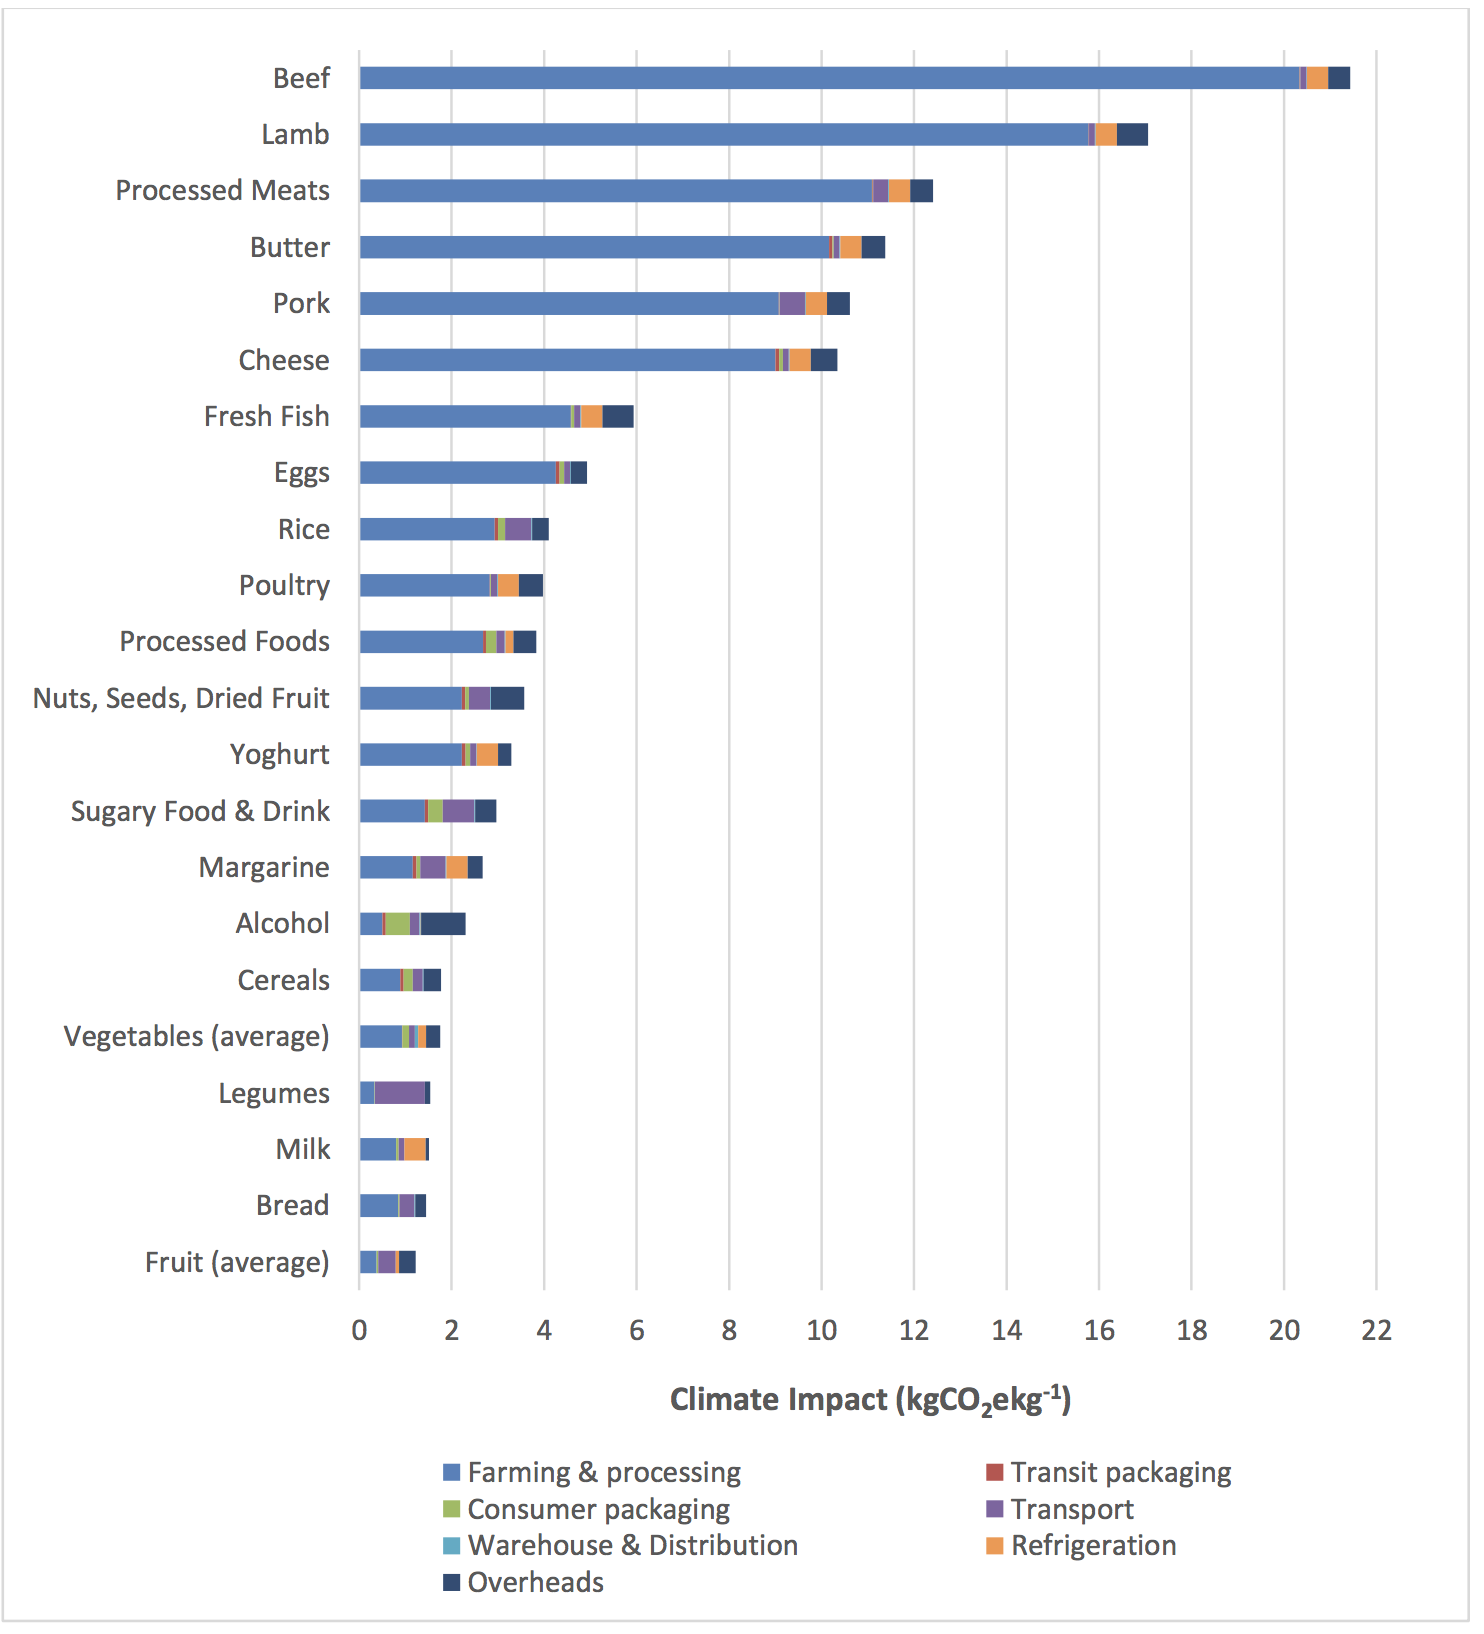
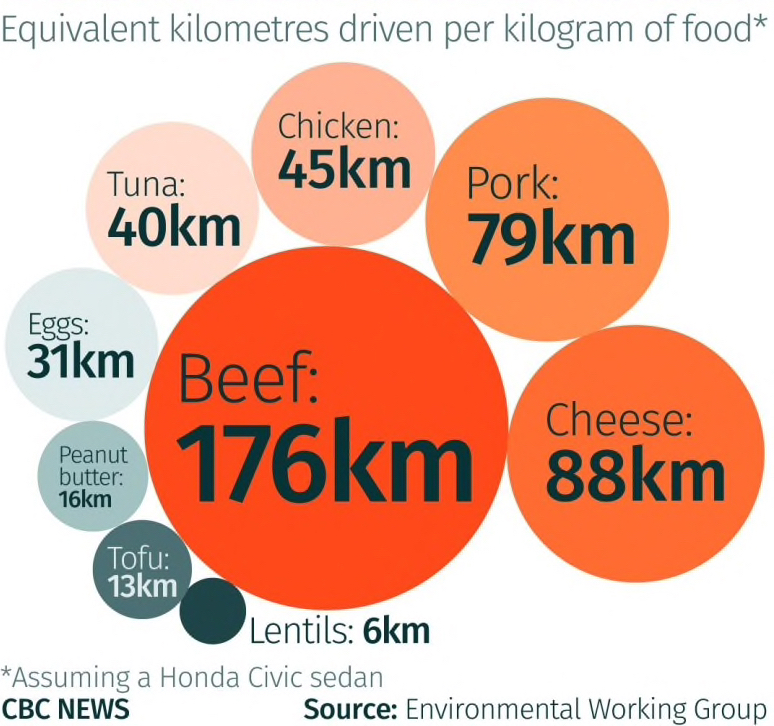
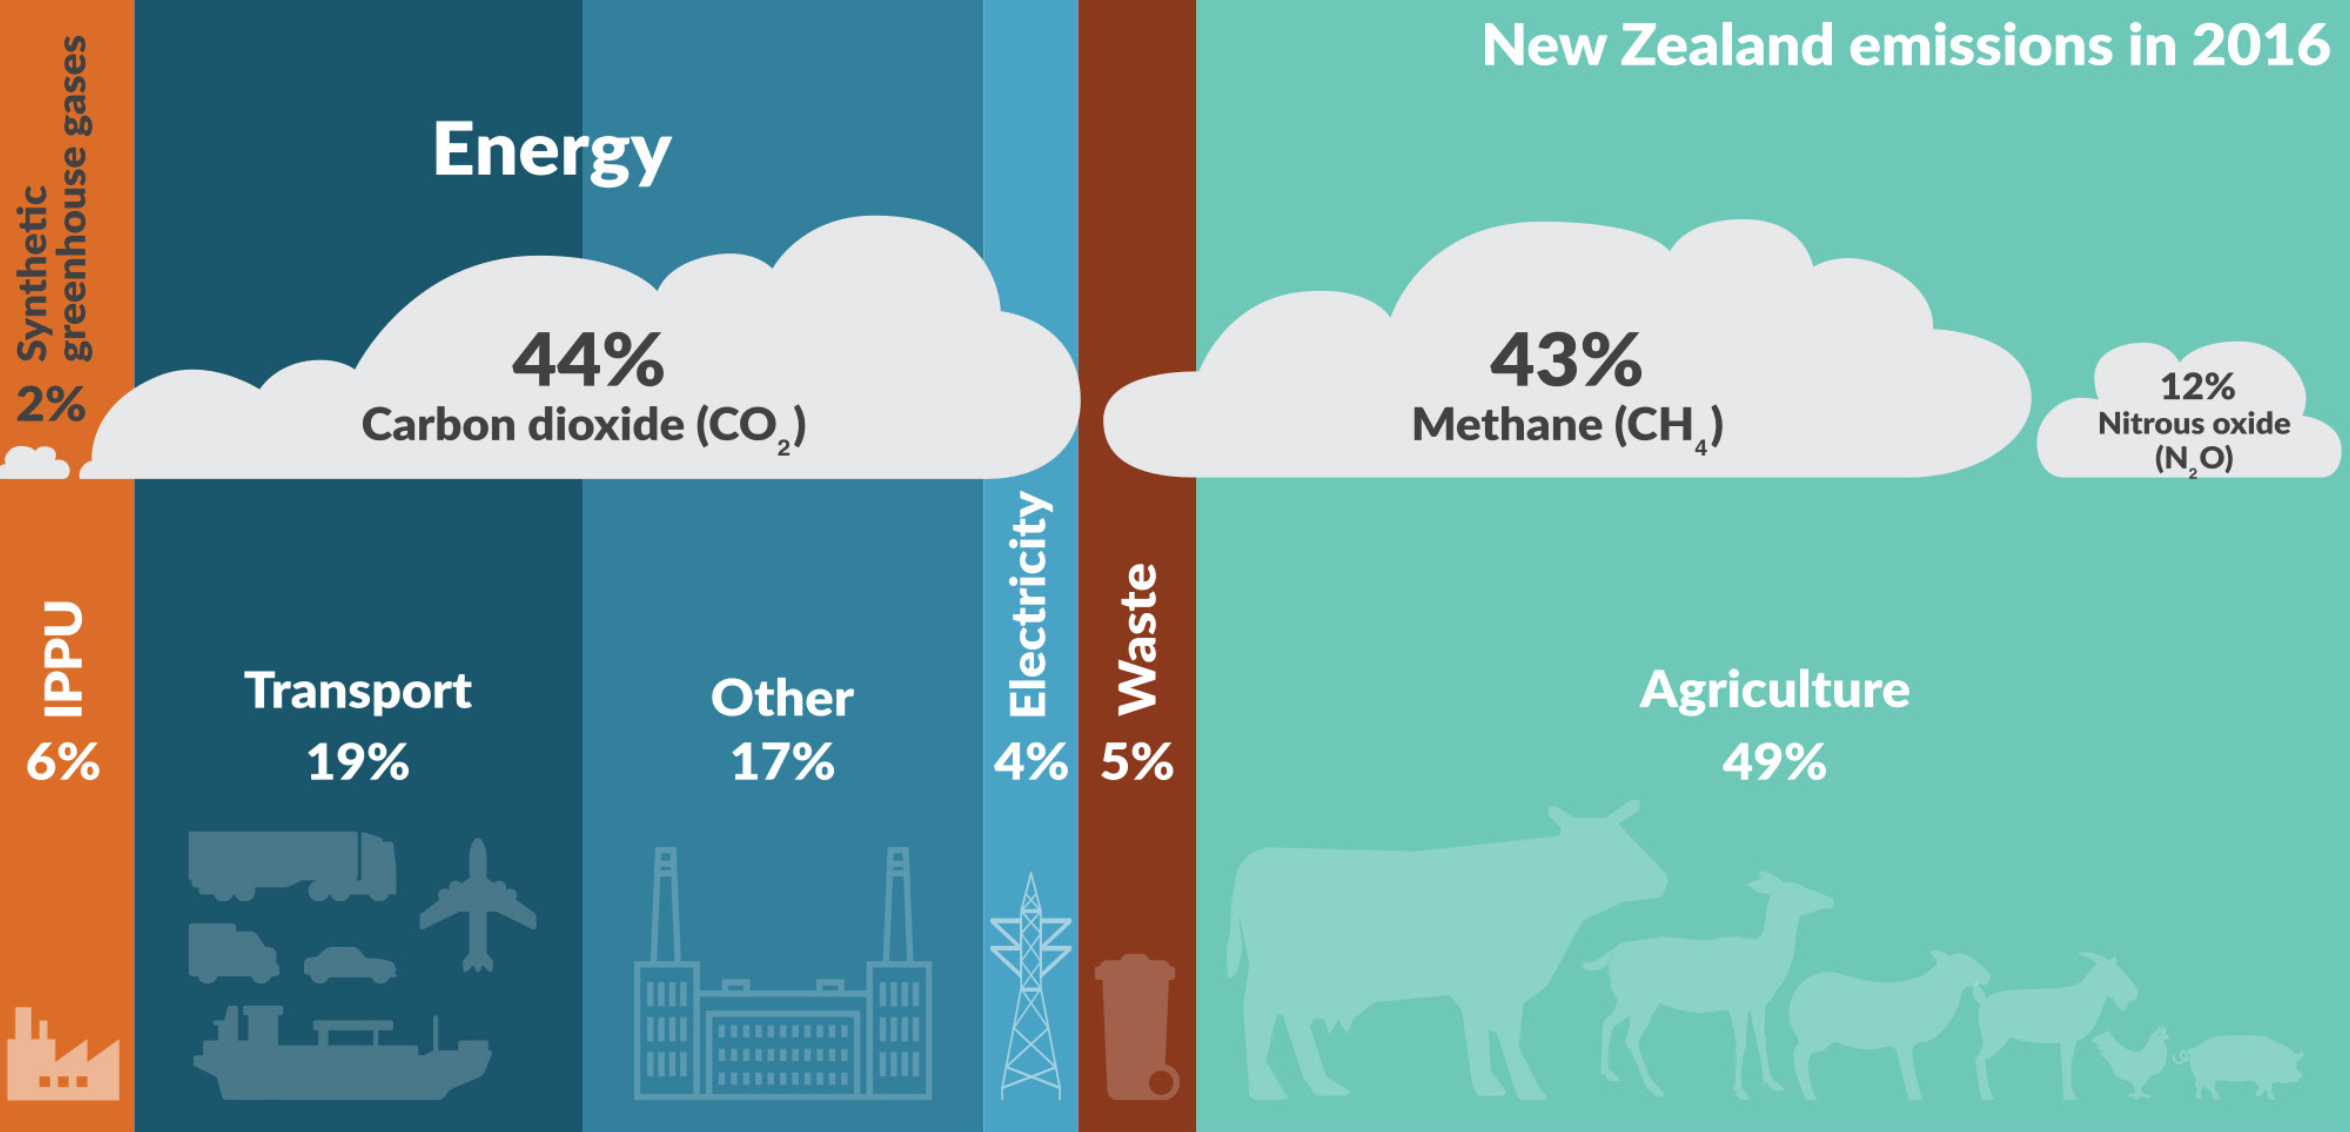
In New Zealand, agriculture and road transport produce 68% of all greenhouse gas emissions, so the biggest way to reduce your impact is to:
- eat less meat and dairy products or cut these from your diet completely, and
- travel and commute by public transport, cycling, walking, or electric vehicle, and fly less.
It also helps to use renewables and be energy-efficient. Small actions by many people will add up to big reductions in emissions.
Lifestyle changes by individuals are important but are not enough in themselves, as the solution depends on transformational changes to our systems of energy, transport, and food production, and this requires action by local and central governments. In this context, you can make a difference by taking part in democracy: vote, make submissions on environmental issues, write letters to politicians, attend meetings, and join environmental groups and attend events.
How do we know this?
Emissions data are compiled by the New Zealand government. Scientific studies and government groups have examined how to reduce emissions.
NZ-specific emissions estimates for common food items
Emissions profile of New Zealand
For information on the changes that we all can make to reduce our contribution to climate change, see:
- the NZ Ministry for the Environment
- the WWF
More general tips regarding lifestyle choices are also provided by the WWF.
Sustainable and nutritious diets
The medical journal The Lancet compiled a report on healthy and sustainable diets and a report on how to provide a nutritious diet to the global population while maintaining a healthy environment.
For information on a sustainable food future, see:
Environmental impacts of food production
The environmental impacts of food production are outlined in a paper in Science magazine and in an article by David Suzuki.
A study in the journal Science emphasises the importance of avoiding meat and dairy (as summarised in The Guardian).
What needs to happen
The IPCC and scientists worldwide have been reporting the risks of catastrophic climate change and the need to reduce greenhouse gas emissions for more than 30 years, yet during this time global emissions have accelerated sharply.
The high emissions mean that the world is on track to exceed 1.5°C of warming within 8 to 15 years, as counted down by various ‘climate clocks’ based on the ‘climate budget’ (the amount of greenhouse gasses that can be emitted while still keeping global warming within the limit of 1.5°C).
The best chance of avoiding 1.5°C warming is immediate reductions in emissions, achieving net zero emissions as soon as possible (various groups set targets ranging from 2025 to 2050 for achieving net zero emissions). Some individuals, cities, companies, and countries have started to take action to limit warming and adapt to the effects of climate change. Others continue with a business-as-usual approach.
Scientific research into all aspects of climate change is continuing and the IPCC’s Sixth Assessment Report was released in the first half of 2022.
Further reading on carbon budget
For details on the carbon budget, see Carbon Tracker.
For an explanation of the carbon budget over the next 12 years, see the World Resources Institute.
The WWF provides a detailed explanation of a carbon budget.
A detailed guide to understanding carbon budgets is provided by Carbon Brief.
Carbon Clock
Carbon clocks (counting down the time until we exceed 1.5°C of warming) are provided by:
For a live count of atmospheric CO2 levels and other graphics, see Bloomberg.
